Modern technologies enables ever greater amount of data to be generated and captured.
Most of the data can be processed in near real-time as a perpetual stream of data. Which enable the creation of system that reveal instant insights and trends and take responsive actions.
Analytical data processing typically uses read-only (or read-mostly) systems that store vast volumes of historical data or business metrics. Analytics can be based on a snapshot of the data at a given point in time, or a series of snapshots.
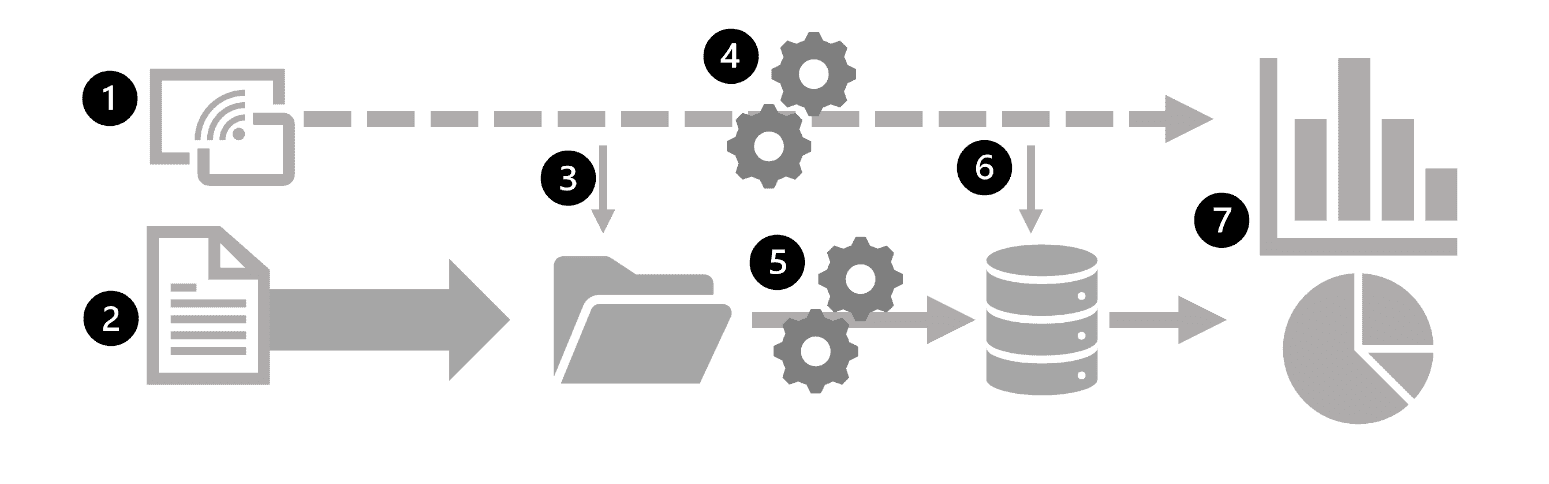
The specific details for an analytical processing system can vary between solutions, but a common architecture for enterprise-scale analytics looks like this:
Data files may be stored in a central data lake for analysis. An extract, transform, and load (ETL) process copies data from files and OLTP databases into a data warehouse that is optimized for read activity. Commonly, a data warehouse schema is based on fact tables that contain numeric values you want to analyze (for example, sales amounts), with related dimension tables that represent the entities by which you want to measure them (for example, customer or product), Data in the data warehouse may be aggregated and loaded into an online analytical processing (OLAP) model, or cube. Aggregated numeric values (measures) from fact tables are calculated for intersections of dimensions from dimension tables. For example, sales revenue might be totaled by date, customer, and product. The data in the data lake, data warehouse, and analytical model can be queried to produce reports, visualizations, and dashboards. Data lakes are common in large-scale data analytical processing scenarios, where a large volume of file-based data must be collected and analyzed.
Data warehouses are an established way to store data in a relational schema that is optimized for read operations – primarily queries to support reporting and data visualization. The data warehouse schema may require some denormalization of data in an OLTP data source (introducing some duplication to make queries perform faster).
An OLAP model is an aggregated type of data storage that is optimized for analytical workloads. Data aggregations are across dimensions at different levels, enabling you to drill up/down to view aggregations at multiple hierarchical levels; for example to find total sales by region, by city, or for an individual address. Because OLAP data is pre-aggregated, queries to return the summaries it contains can be run quickly.
Different types of user might perform data analytical work at different stages of the overall architecture. For example:
Data scientists might work directly with data files in a data lake to explore and model data. Data Analysts might query tables directly in the data warehouse to produce complex reports and visualizations. Business users might consume pre-aggregated data in an analytical model in the form of reports or dashboards.
Data processing: The conversion of raw data to meaningful information through a process.
- Batch processing, in .
- Stream processing, in which a source of data is constantly monitored and processed in real time as new data events occur.
Batch: Multiple data records are collected and stored before being processed together in a single operation.
Advantage
| Batch | Stream | |
|---|---|---|
| Definition | Multiple data records are collected and stored before being processed together in a single | data is processed as individual units in real-time |
| Advantage | Large volumes of data can be processed at a convenient time; Can be scheduled to run at a time when computers or systems might otherwise be idle, such as overnight, or during off-peak hours. | Ideal for time-critical operations that require an instant real-time response. (e.g A real-estate website that tracks a subset of data from mobile devices, and makes real-time property recommendations of properties to visit based on their geo-location.) |
| Disadvantage | The time delay between ingesting the data and getting the results. All of a batch job's input data must be ready before a batch can be processed. This means data must be carefully checked. Problems with data, errors, and program crashes that occur during batch jobs bring the whole process to a halt. The input data must be carefully checked before the job can be run again. Even minor data errors can prevent a batch job from running. | N/A |
| Data Scope | process all the data in the dataset | Stream processing typically only has access to the most recent data received, or within a rolling time window(e.g Last 30 seconds) |
| Data Size | handling large datasets efficiently | individual records or micro batch consisting of few records |
| Peformance | ~few hours | Almost instant |
| Analysis | perform complex analytics | simple response functions, aggregates, or calculations such as rolling averages |
- Data events from a streaming data source are captured in real-time.
- Data from other sources is ingested into a data store (often a data lake) for batch processing.
- If real-time analytics is not required, the captured streaming data is written to the data store for subsequent batch processing.
- When real-time analytics is required, a stream processing technology is used to prepare the streaming data for real-time analysis or visualization; often by filtering or aggregating the data over temporal windows.
- The non-streaming data is periodically batch processed to prepare it for analysis, and the results are persisted in an analytical data store (often referred to as a data warehouse) for historical analysis.
- The results of stream processing may also be persisted in the analytical data store to support historical analysis.
- Analytical and visualization tools are used to present and explore the real-time and historical data.
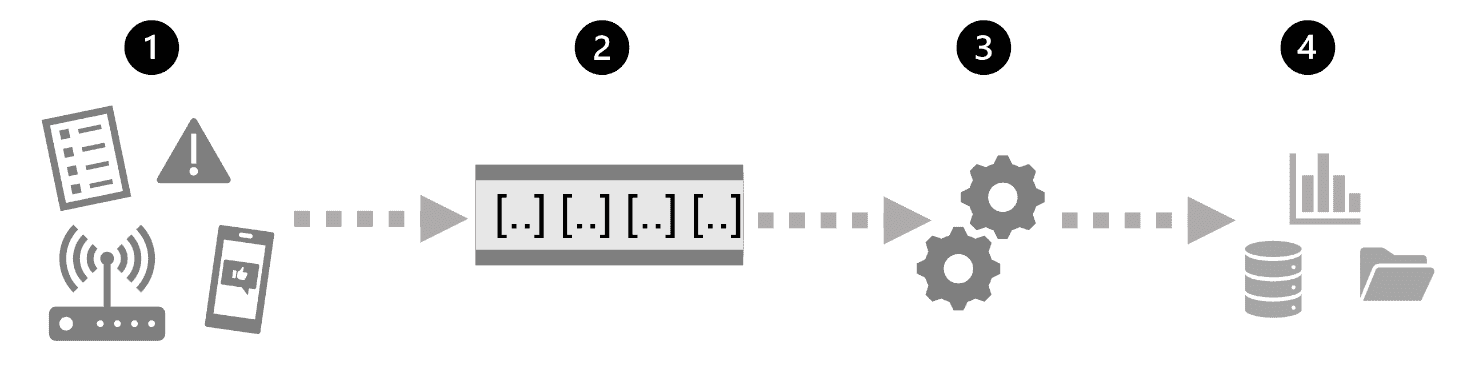
Azure stream analytics general architecture
- An event generates some data. This might be a signal being emitted by a sensor, a social media message being posted, a log file entry being written, or any other occurrence that results in some digital data.
- The generated data is captured in a streaming source for processing. In simple cases, the source may be a folder in a cloud data store or a table in a database. In more robust streaming solutions, the source may be a "queue" that encapsulates logic to ensure that event data is processed in order and that each event is processed only once.
- The event data is processed, often by a perpetual query that operates on the event data to select data for specific types of events, project data values, or aggregate data values over temporal (time-based) periods (or windows) - for example, by counting the number of sensor emissions per minute.
- The results of the stream processing operation are written to an output (or sink), which may be a file, a database table, a real-time visual dashboard, or another queue for further processing by a subsequent downstream query.
Real-time analytics in Azure
Microsoft Azure supports multiple technologies that you can use to implement real-time analytics of streaming data, including:
- Azure Stream Analytics: A platform-as-a-service (PaaS) solution that you can use to define streaming jobs that ingest data from a streaming source, apply a perpetual query, and write the results to an output.
- Spark Structured Streaming: An open-source library that enables you to develop complex streaming solutions on Apache Spark based services, including Azure Synapse Analytics, Azure Databricks, and Azure HDInsight.
- Azure Data Explorer: A high-performance database and analytics service that is optimized for ingesting and querying batch or streaming data with a time-series element, and which can be used as a standalone Azure service or as an Azure Synapse Data Explorer runtime in an Azure Synapse Analytics workspace.
Sources for stream processing
The following services are commonly used to ingest data for stream processing on Azure:
- Azure Event Hubs: A data ingestion service that you can use to manage queues of event data, ensuring that each event is processed in order, exactly once.
- Azure IoT Hub: A data ingestion service that is similar to Azure Event Hubs, but which is optimized for managing event data from Internet-of-things (IoT) devices.
- Azure Data Lake Store Gen 2: A highly scalable storage service that is often used in batch processing scenarios, but which can also be used as a source of streaming data.
- Apache Kafka: An open-source data ingestion solution that is commonly used together with Apache Spark. You can use Azure HDInsight to create a Kafka cluster.
Sinks for stream processing
The output from stream processing is often sent to the following services:
- Azure Event Hubs: Used to queue the processed data for further downstream processing.
- Azure Data Lake Store Gen 2 or Azure blob storage: Used to persist the processed results as a file.
- Azure SQL Database or Azure Synapse Analytics, or Azure Databricks: Used to persist the processed results in a database table for querying and analysis.
- Microsoft Power BI: Used to generate real time data visualizations in reports and dashboards.
Azure Stream Analytics
Service for complex event processing and analysis of streaming data. It handles Ingest / Process / Output
- Simple workflow: Stream Analytics job
- Complex workflow: Stream Analysis cluster
Apache Spark on Microsoft Azure
-
Spark Structured Streaming: Used for real-time analytics when you need to incorporate streaming data into a Spark based data lake or analytical data store. process streaming data on Spark. Spark Structured Streaming library provides an application programming interface (API) for ingesting, processing, and outputting results from perpetual streams of data.
-
Delta Lake: an open-source storage layer that adds support for transactional consistency, schema enforcement, and other common data warehousing features to data lake storage. Unifies storage for streaming and batch data, and can be used in Spark to define relational tables for both batch and stream processing.